
The Deep Analysis feature is currently in beta and is available to all Admin users.
Perform a Deep Analysis
Follow the steps below to run a complete investigation, from enabling the feature to exploring the final report.Step 1: Enable Deep Analysis Mode
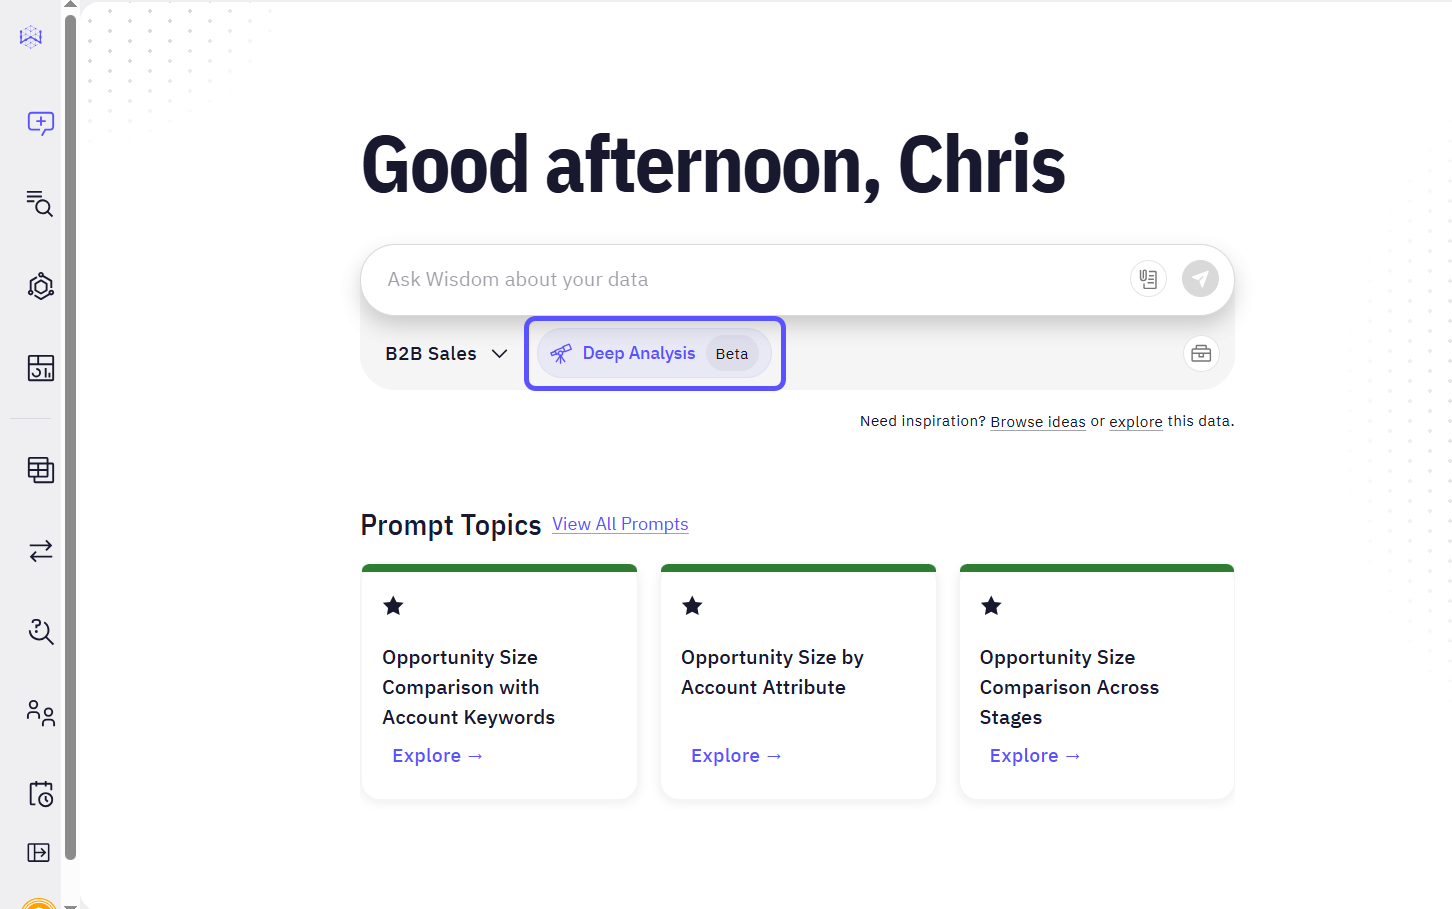
Before asking a question, enable Deep Analysis mode in the chat interface.- In a new or existing chat, locate the Deep Analysis toggle.
- Click the toggle to enable it. Once enabled, all subsequent questions you ask in this chat will use Deep Analysis until you disable it.
Step 2: Ask an Open-Ended Question
With Deep Analysis enabled, ask a question that requires investigation rather than a simple answer. These questions often start with “Why,” “Investigate,” or “What are the main drivers of…”. For example, you could ask:Investigate why there was a spike in Q4 2023 revenue compared to Q3 2023.
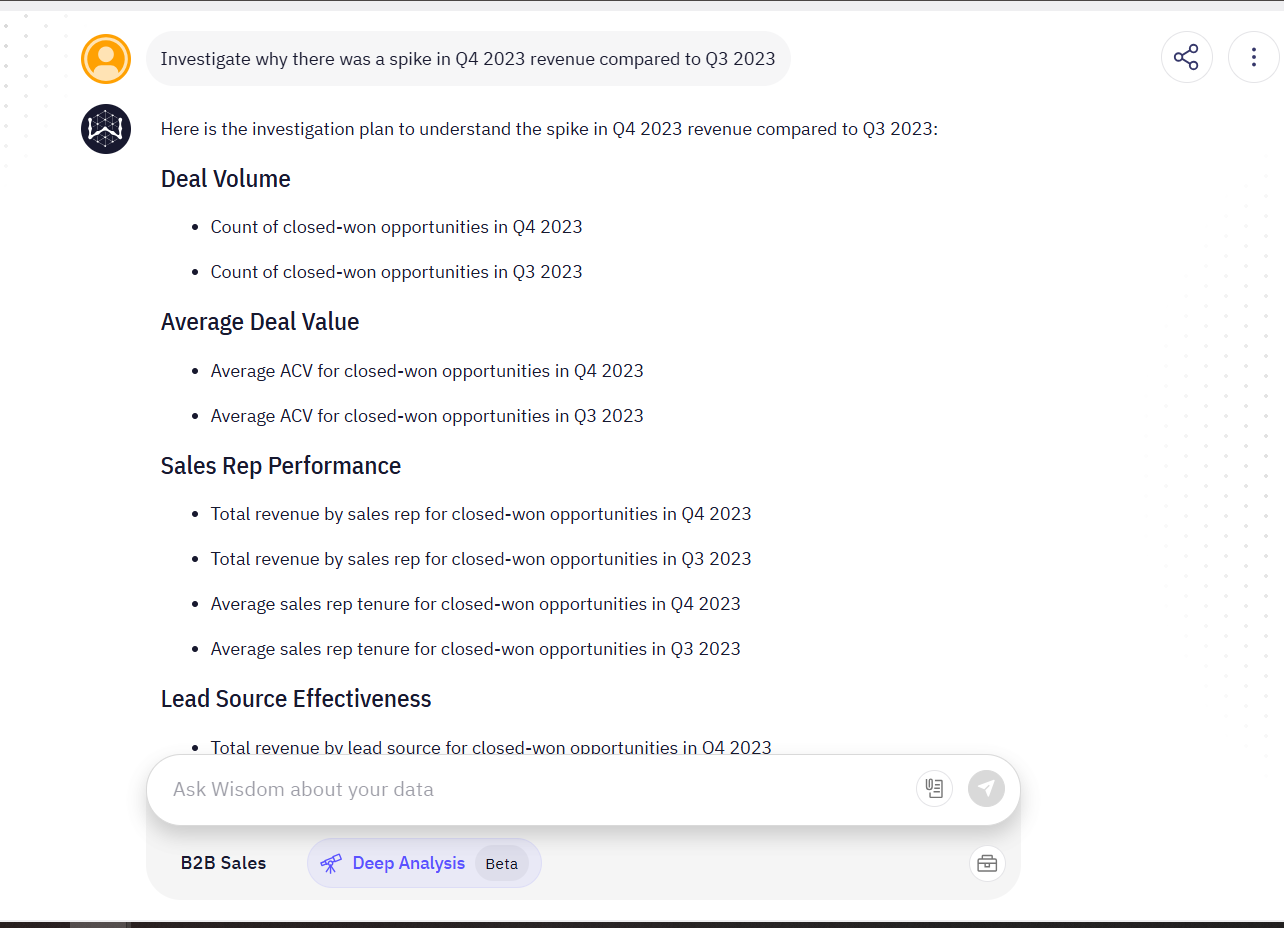
Step 3: Review and Refine the Analysis Plan
After you submit your question, Deep Analysis will not immediately run the full investigation. Instead, it generates a proposed plan outlining the steps it will take to answer your question. This is your opportunity to guide the analysis:- Review the steps: Read through the proposed plan to ensure it aligns with your goals.
- Modify the plan: You can ask the system to change the plan using natural language. For example, you can remove steps (“don’t do these last five steps”) or add new ones (“also do a competitive analysis”).
- Approve the plan: If the plan looks correct, type
continue with the investigationsto begin the analysis.
Step 4: Monitor the Investigation
Once you approve the plan, the system begins executing the investigation. This process can take several minutes. A sidebar will appear, showing the real-time progress of each step in the analysis plan.You can navigate away from the chat, start a new one, or continue with other work; the analysis will continue running in the background. Closing the browser tab will not interrupt the process.You can always return to the chat to check the progress. The analysis status is saved in a persistent card that you can click to reopen the progress view.
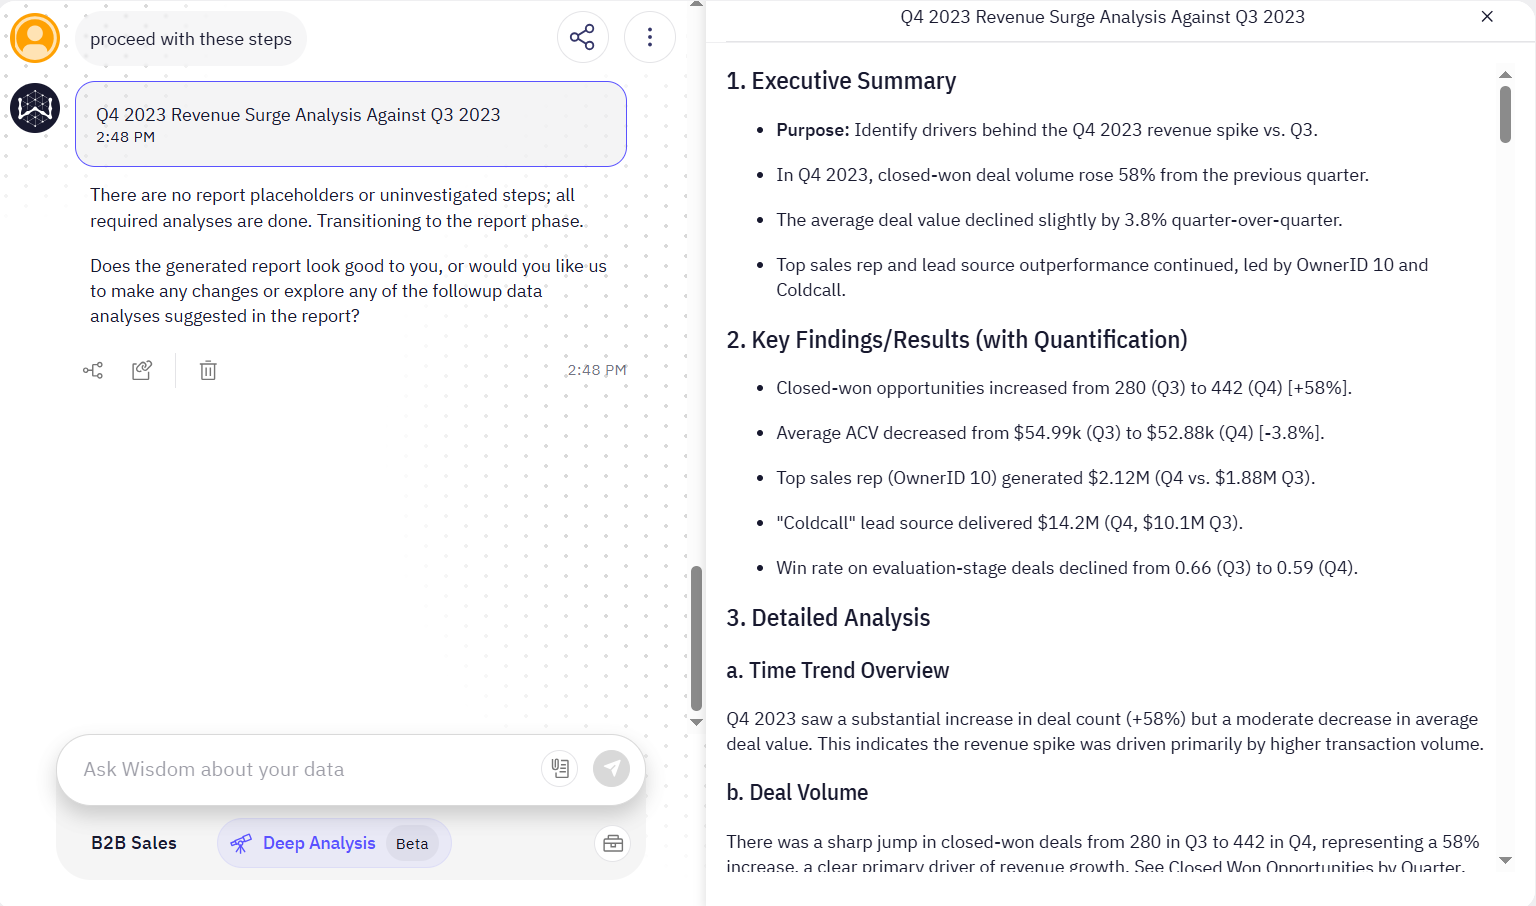
Step 5: Explore the Final Report
When the investigation is complete, Deep Analysis compiles the findings into a detailed report. You can open the report from the chat, and it will be displayed in the side panel. The report typically includes:- An executive summary: A high-level overview of the main findings.
- Key findings: Detailed points explaining the results of the investigation.
- Detailed Analysis: This section presents the in-depth results of the investigation, which can be broken down into various sub-topics like time trends, deal volume, or lead source effectiveness.
- Visualizations: Charts and tables embedded within the report to support the findings.
- Conclusions and Actionable Insights: This section synthesizes the key findings into a clear conclusion and provides practical takeaways.
- Follow-up data analysis: The report suggests new questions to guide your next steps.
generate a shorter one page version of the report, to refine the insights further.
Use Case Examples
Deep Analysis is ideal for situations where a single data point isn’t enough to understand the full picture.Investigating a Performance Spike
This is a primary use case for conducting root cause analysis when a key metric changes unexpectedly.- Scenario: You notice a sudden increase in user engagement for a specific feature and need to understand the cause.
- Question:
Investigate the key drivers for the spike in user engagement for the 'new dashboard' feature last month. - Outcome: Deep Analysis generates a report identifying the primary causes, such as a recent marketing campaign, a new integration partner driving traffic, or a specific segment of users heavily adopting the feature. The report would include charts breaking down engagement by user segment and traffic source.
Understanding Complex Business Trends
Use Deep Analysis for exploratory analysis when the factors influencing a trend are not immediately apparent.- Scenario: Your quarterly report shows an increase in customer churn, but the high-level numbers don’t explain why it’s happening.
- Question:
What are the primary factors contributing to customer churn in Q2? - Outcome: The system creates a plan to segment churned customers by subscription plan, region, product usage, and signup date. The final report reveals that customers on a specific plan who do not adopt a key feature within their first 30 days are the most likely to churn, providing actionable insight for the product team.