- Create dynamic narratives using your data.
- Customize layouts and visuals from responses to suit your audience.
- Share updates that automatically reflect the changes in your datasets.
Create Stories from Chat Responses
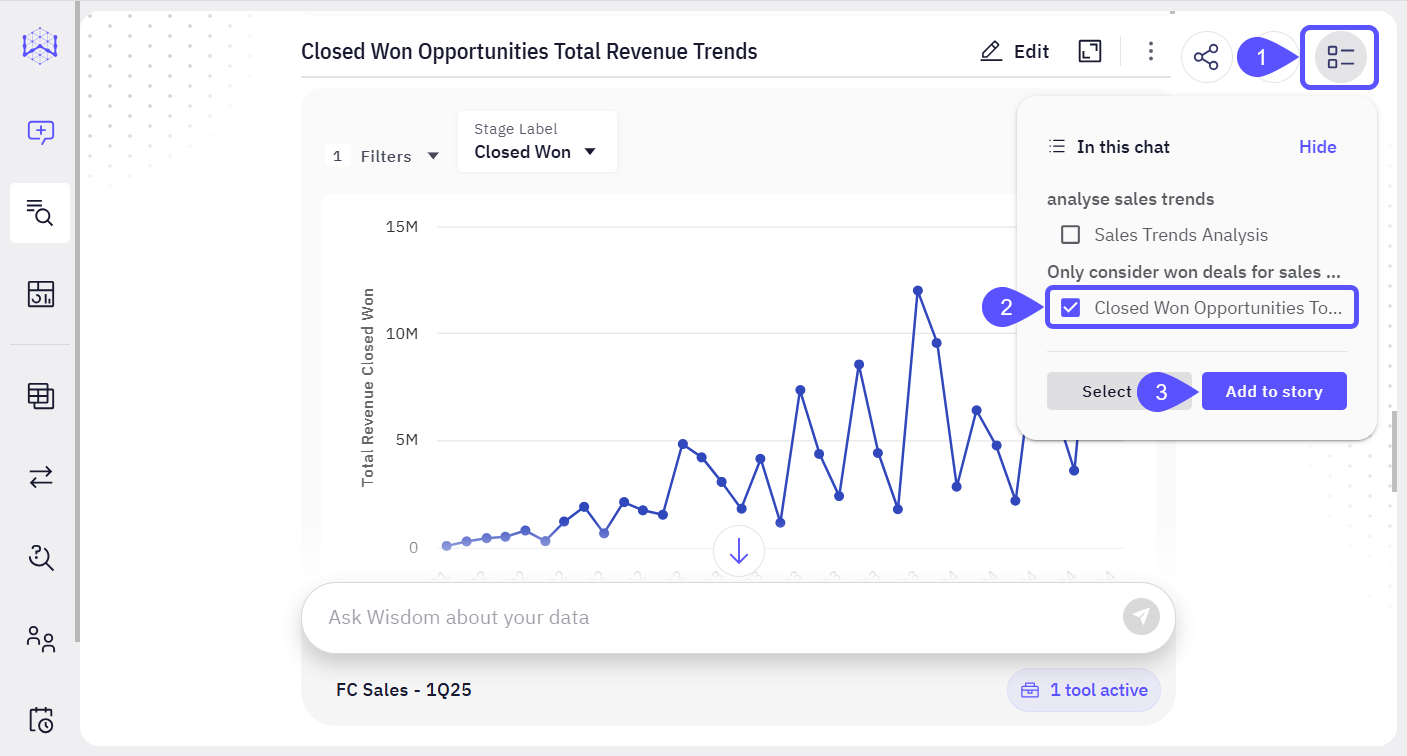
- Within your chat window, click on the contextual menu icon labeled “In this chat.”
- Select one or more answers that you would like to include in your Story.
- Click on Add to Story.
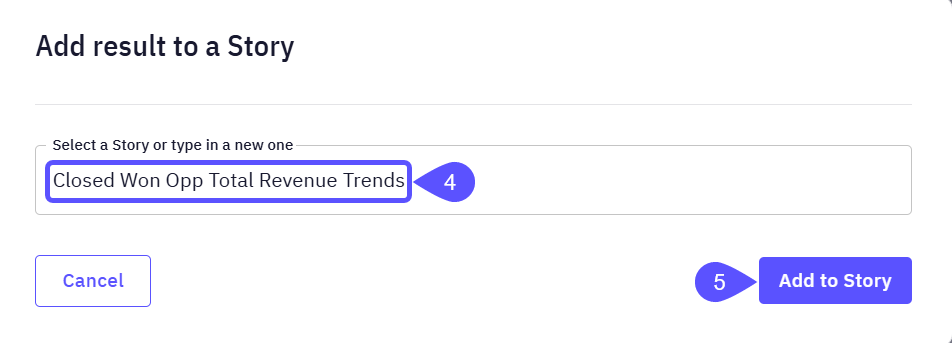
- In the modal window that opens, type the title of the new Story or select an already created one.
- Click the Add to story button. Your Story is now created and saved.
Create Stories from the Story Editor
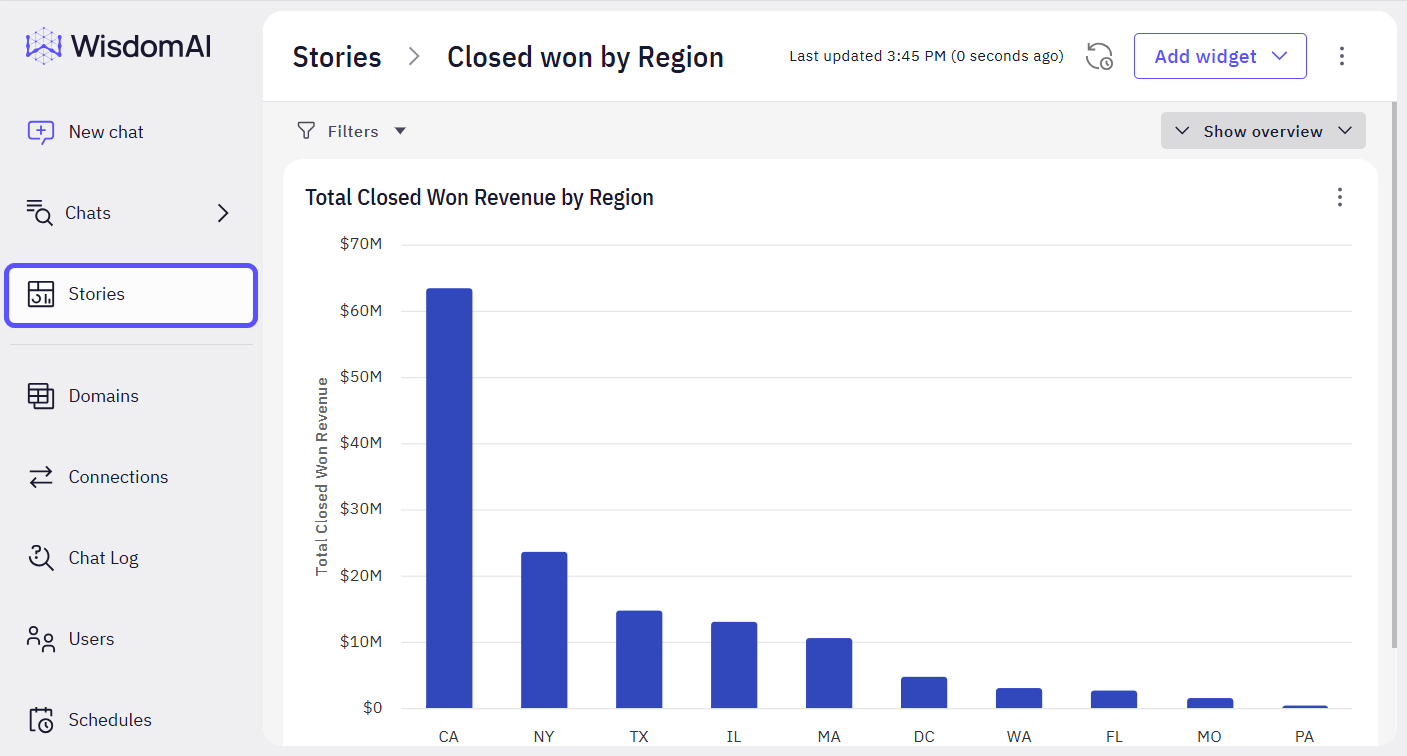
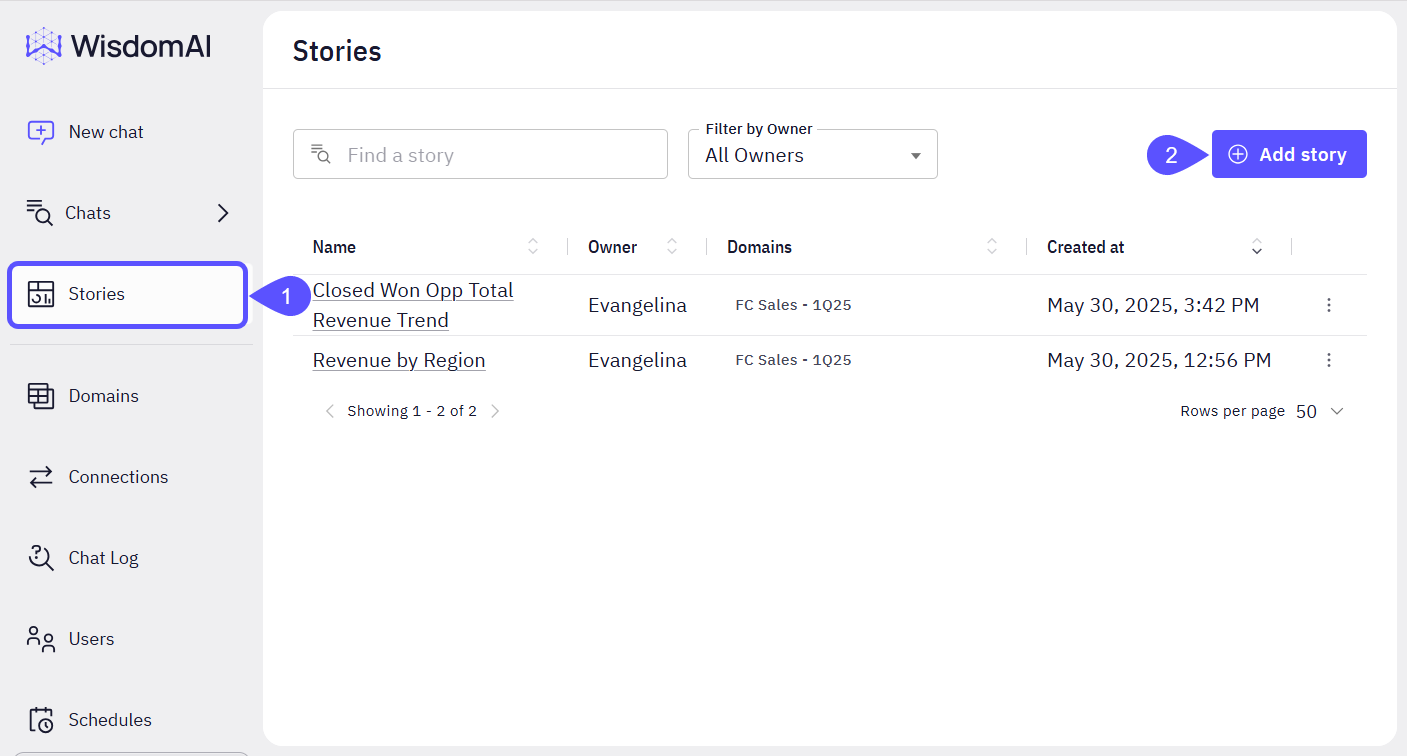
- Open Stories in the left sidebar.
- Click on the Add Story button.
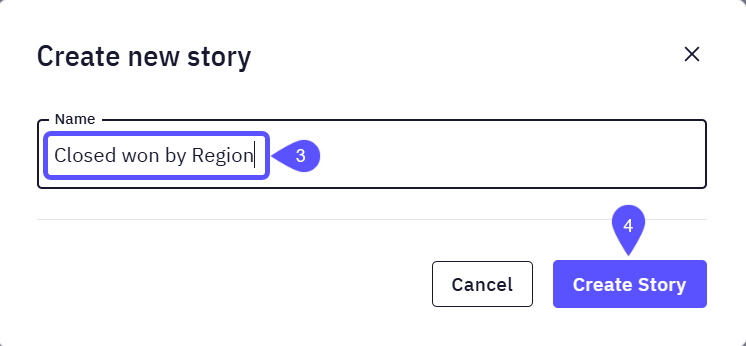
- Add a relevant name to your Story.
- Click on Create Story.
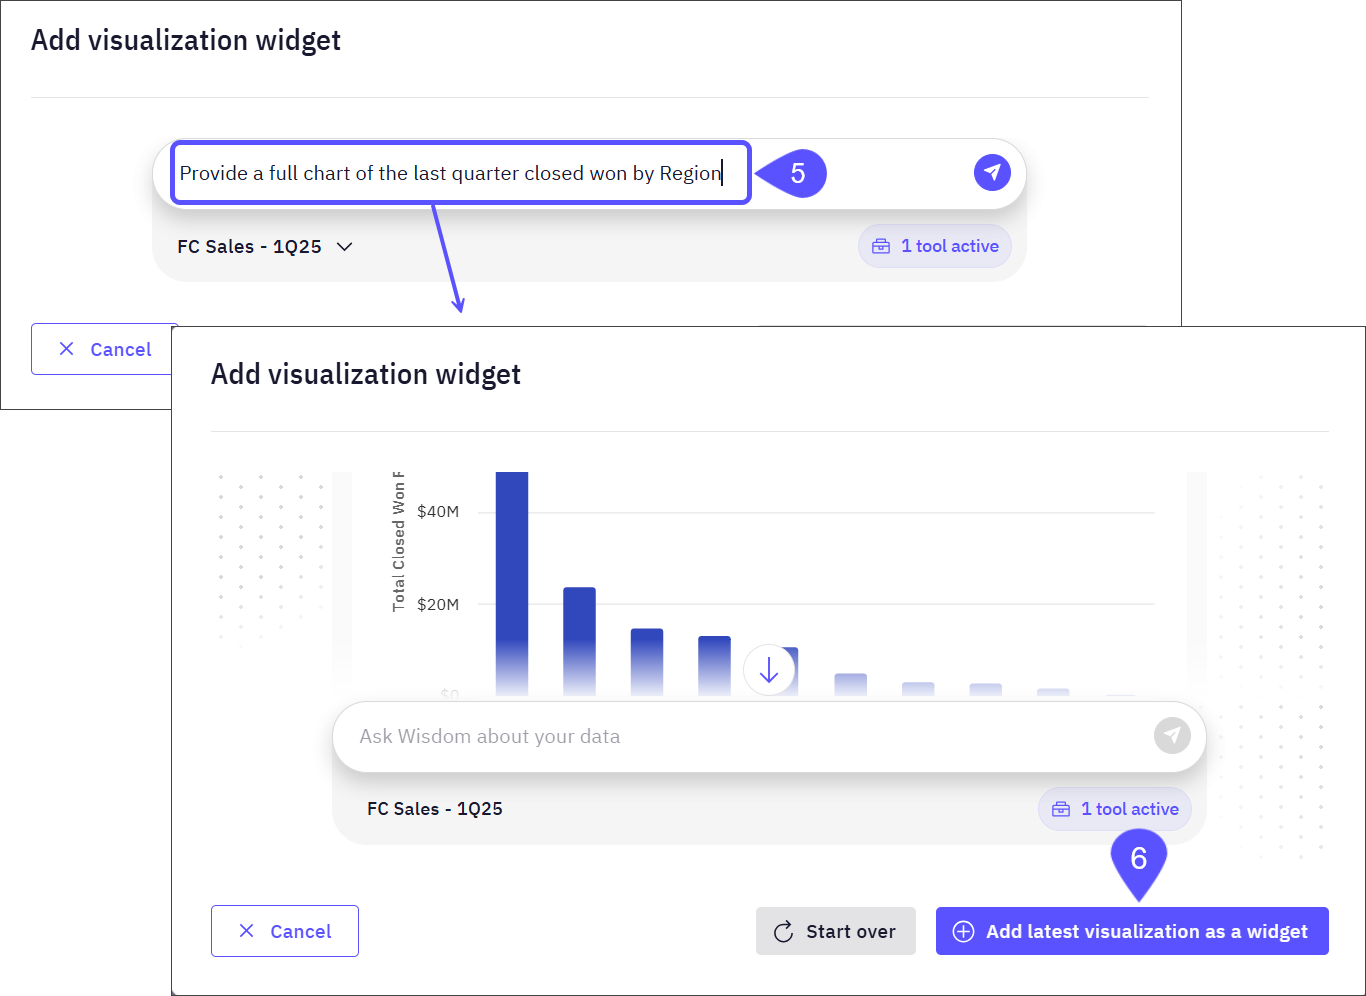
- The Add visualization widget modal window will open. In this window, you can ask WisdomAI a question about your data in natural language. Based on your question and query, WisdomAI may generate a visual representation, such as a chart or graph, that you can review and add directly to the Story.
- Click on the Add latest visualization as a widget button to save the response (a chart in this example) in the Story.